
This post contains a detailed overview of the vmstat command, its syntax, options, and practical applications.
Contents
- 1 vmstat Command
- 2 Installation(if not preinstalled)
- 3 How to install the “sysstat” command in Ubuntu/Debian?
- 4 How to install the “sysstat” command in Fedora/CentOS/RHEL?
- 5 How to install the “sysstat” command in Arch Linux?
- 6 Basic Understanding of vmstat Command
- 7 Options of vmstat Command
- 8 Memory and Process Stats
- 9 How to display active and inactive memory using vmstat?
- 10 How to display the number of forks using vmstat?
- 11 How to display slab statistics using vmstat?
- 12 How to display the header using vmstat?
- 13 How to display a table of multiple event counters using vmstat?
- 14 1. Memory Usage
- 15 2. CPU Stats:
- 16 3. Memory Paging
- 17 4. Event Counters
- 18 How to display disk stats using vmstat?
- 19 1. Reads
- 20 2. Writes
- 21 Secondary Options
- 22 How to get disk activity report using vmstat?
- 23 How to get Partition stats using vmstat?
- 24 How to add a timestamp to the vmstat report?
- 25 How to display version information using vmstat?
- 26 How to display the help of the vmstat command?
- 27 How to set a delay value between the vmstat report update?
- 28 How to use a count value with delay in the vmstat command?
- 29 How to change units of the output in the vmstat command?
- 30 Conclusion
vmstat Command
The vmstat command serves as a potent performance monitoring tool in Linux, offering information about memory usage, system processes, block IO, paging, disk activities, and CPU scheduling. Users can specify a sampling period to record real-time activity making it an essential utility for performance and diagnosing possible issues.
Installation(if not preinstalled)
Before using vmstat, ensure that the sysstat package is installed in the Linux environment. Make sure to use the appropriate package manager based on Linux distribution:
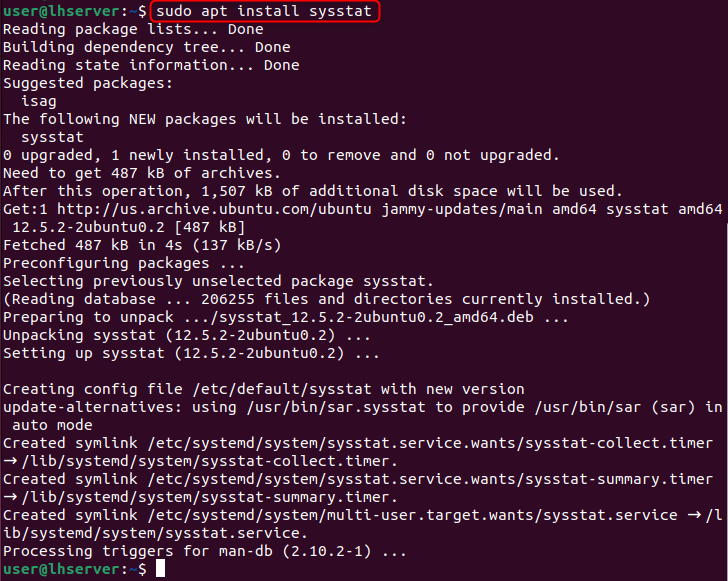
How to install the “sysstat” command in Ubuntu/Debian?
To install the “sysstat” command on Ubuntu or Debian-based operating systems, execute the command typed below:
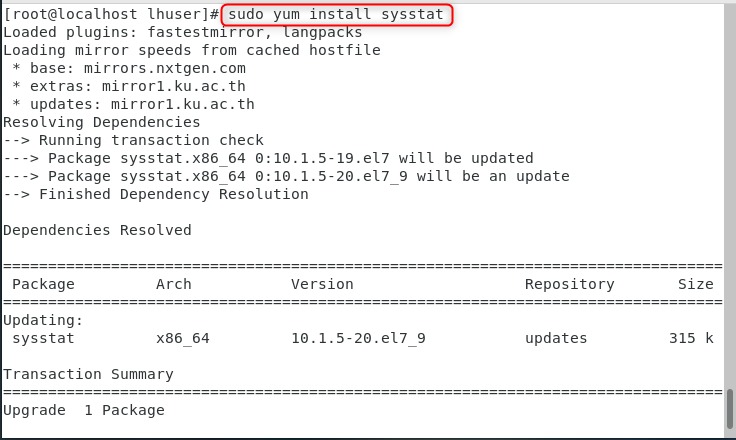
How to install the “sysstat” command in Fedora/CentOS/RHEL?
To install the “sysstat” command on Fedora/CentOS or RHEL-based operating systems, execute the command typed below:
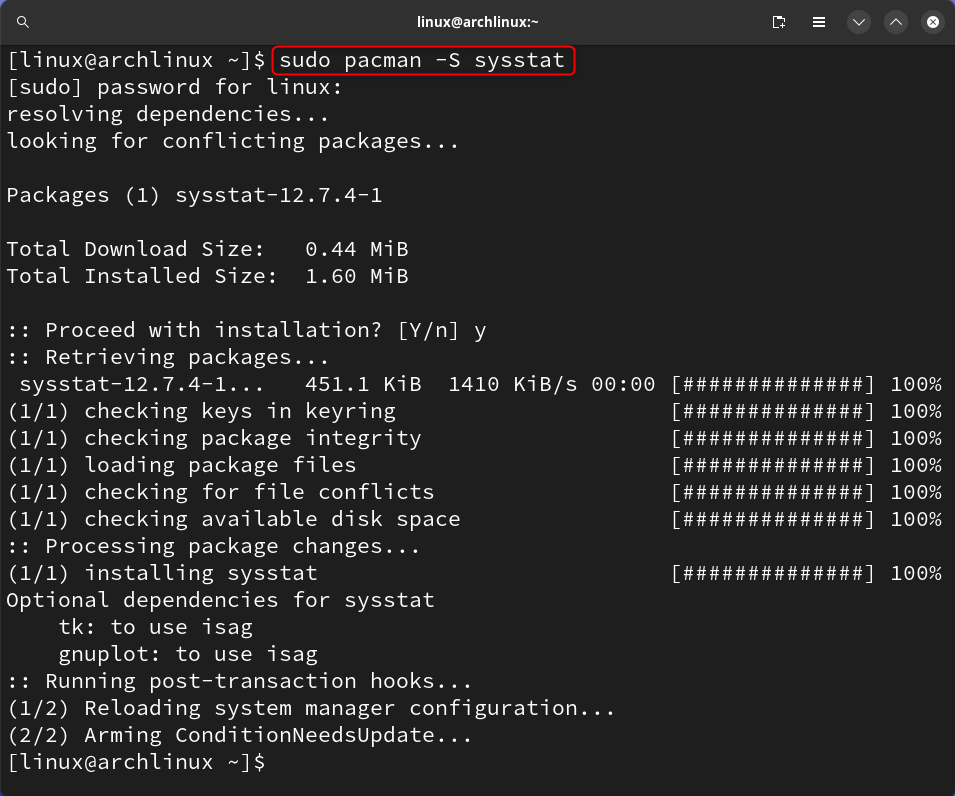
How to install the “sysstat” command in Arch Linux?
To install the “sysstat” command on an Arch Linux-based operating system, execute the command typed below:
Once it is installed in your desired operating system, Let’s jump into its usage and understanding.
Syntax
The base syntax for the vmstat command is as follows:
vmstat [options][delay [count]]
In the above vmstat command syntax:
Options: flags used for customized output
Delay: This is the time duration between two updates/reports. In case, there is no delay value specified, then only one sampling period report will be printed with mean value since boot.
Count: This mentions the number of updates/reports required after the specified delay value. If the delay is specified and the count is not present then the count has an infinite value as default.
Alright, we will dive deep into the understanding and utilization of options available by the vmstat command. We will also discuss, how the usage of delay and count can help us in getting the required results.
However, first, let’s start with understanding the basic output of the “vmstat” command.
Basic Understanding of vmstat Command
Let’s run the vmstat command without any option and delay and analyze the results.
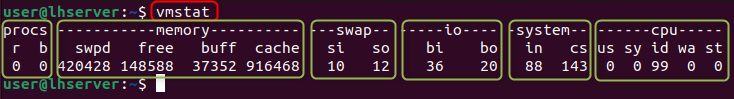
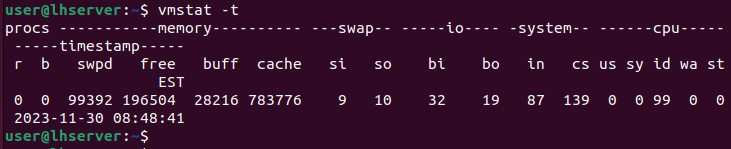
All the sections, fields, and values are explained below:
procs: Process Stats
r: Running/Active processes
b: Blocked/Sleep processes waiting for I/O operations
memory: Memory Stats(in KBs)
swpd: Used virtual memory
free: Free memory
buff: Buffer memory
cache: Cache memory
swap: Swap space stats(in KB/s)
si: Memory swapping in
so: Memory swapping out
io: I/O Stats(in Blocks/sec)
bi: Blocks received
bo: Blocks sent
system: Scheduling Stats(per second)
in: System interrupts
cs: Context switches
cpu: CPU time(in percentages)
us: Time spent on user code
sy: Time spent on system/kernal code
id: Idle time
wa: Time spent waiting for I/O
st: Time stolen by Virtualized Environments
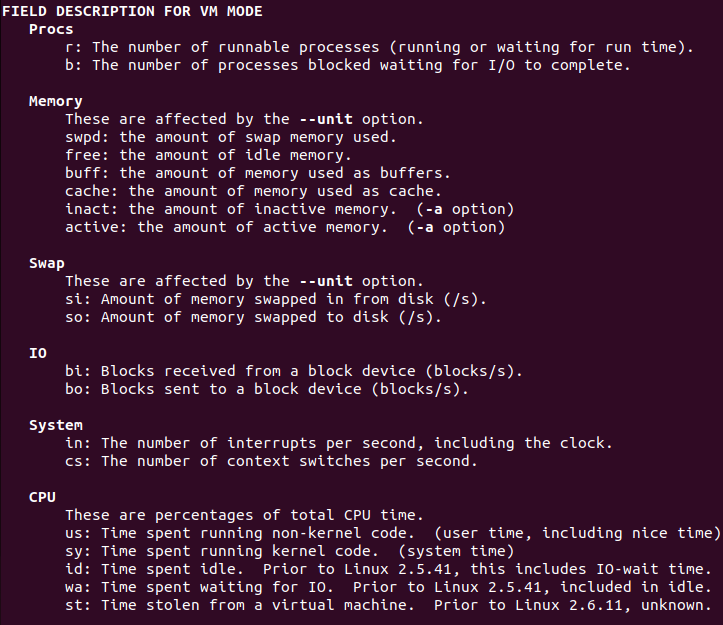
The best source of understanding the output of the vmstat command is the man page of vmstat which provides detailed and concise information about the displayed output.
For more details regarding the vmstat command, execute the command:
It displays a user manual of the vmstat command.
For example, to know about the description of the above-executed command; read the following section of the man page.
Alright, now let’s dive deep into the understanding of the options available and have an insight into the output of each option.
Options of vmstat Command
There are different options available for fetching various types of stats. Some of the widely used options are explained below with a demonstration.
Memory and Process Stats
Following are the commands that are categorized and used for getting memory and process stats.
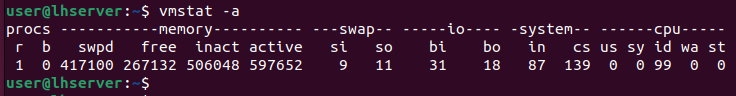
How to display active and inactive memory using vmstat?
To get memory stats in the form of active and inactive usage(instead of buffer and cache usage), the “-a” option is used.
How to display the number of forks using vmstat?
To get the number of forks in bytes, the “-f” option is used.
How to display slab statistics using vmstat?
To display slab statistics, the “-m” option is used.
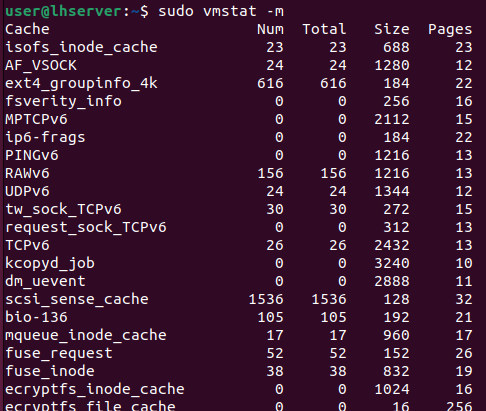
After running this program there will be five columns:
- Cache: name of cached data file.
- Num: the active object number in the cache.
- Total: All objects in the cache.
- Size: The space taken by each object in cache.
- Pages: the count of memory pages holding a stored item.
How to display the header using vmstat?
To display the header only once, the “-n” option is used.
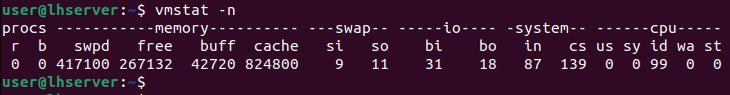
It is evident in the above command output that a header has been added at the top for the columns which include procs, memory, swap, io, system, and CPU.
How to display a table of multiple event counters using vmstat?
To CPU scheduling and memory stats, use the “-s” option:
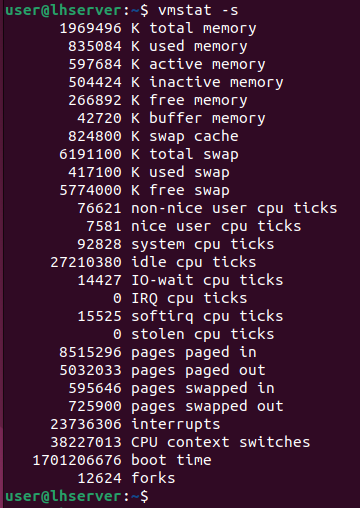
The output is the same as the basic vmstat command except for the split nice and non-nice CPU time.
The above report can be broken down into four sections:
1. Memory Usage
- Total available memory.
- Currently in use memory.
- Active memory
- Inactive memory
- Free memory.
- Buffer memory
- Cache memory
- Swap memory information.
2. CPU Stats:
- Usage for high-priority processes (Non-nice CPU ticks)
- Usage for low-priority processes (Nice CPU ticks)
- Usage for kernel processes (System CPU ticks)
- Idle CPU time (Idle CPU ticks.
- CPU usage for input/output operations (IO-wait)
- Interrupts received by the CPU (IRQ)
- Software interrupts (softirq)
- CPU time stolen by a virtual machine (stolen CPU ticks)
3. Memory Paging
- Pages brought in.
- Pages sent out to virtual memory.
- Pages read from swap memory.
- Pages written.
4. Event Counters
- Interruptions since boot time
- Count of context switches executed.
- Timestamp of the last boot time.
- Total number of forks.
How to display disk stats using vmstat?
To display disk stats, the “-d” option is used.
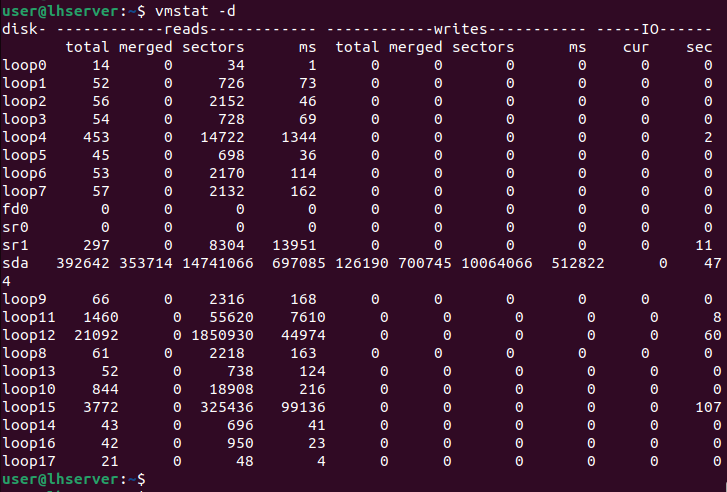
The explanations of each section/column are as follows:
1. Reads
- Total: The time taken to read from the disk
- Merged: The number of reads grouped
- Sectors: The total number of sectors from which the data has been read
- Milliseconds: The measuring speed for the data reading process
2. Writes
- Total: The total number of times information has been written to disk
- Merged: The number of writes grouped
- Sectors. The total number of sectors on which the data has been written
- Milliseconds: The measuring speed for the data writing process
3. IO (Input/Output)
- Current: The number of reads or writes currently under process.
- Seconds: The time utilized on any processing reads or writes measured in seconds.
Secondary Options
Following are the options that are categorized as secondary options and used for fetching different types of details related to virtual memory.
How to get disk activity report using vmstat?
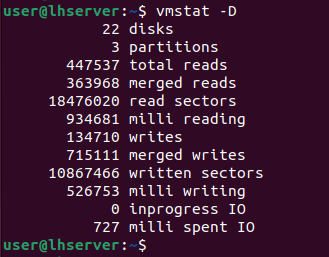
To get a detailed disk activity report, the “-D” option is used.
How to get Partition stats using vmstat?
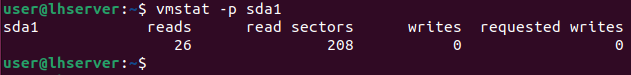
To get detailed partition stats, the “-p” option is used.
This command runs only with an additional parameter in which it needs the name of the partition as well of which we want to know the stats.
How to add a timestamp to the vmstat report?
To add a timestamp to the report, the “-t” option is used.
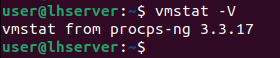
How to display version information using vmstat?
To display version information, the “-V” option is used.
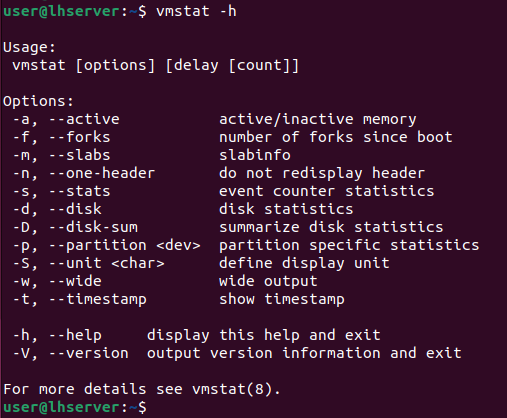
How to display the help of the vmstat command?
To display all the options available in the help menu of the vmstat command, the “-h” option is used.
After discovering all the options available in vmstat, it is time to explore the delay and count values in the vmstat command.
How to set a delay value between the vmstat report update?
To set a delay value between each output update, simply provide the delay value in seconds after the “vmstat” command as shown below:
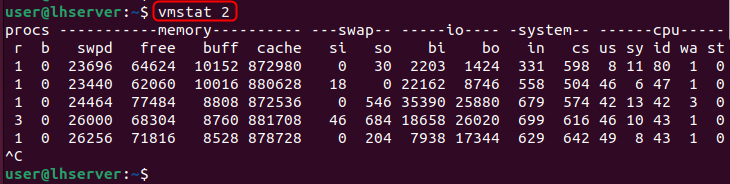
In the above screenshot, the report is getting updated every 2 seconds. It will continue to generate reports every 2 seconds until it is stopped manually using CTRL+C. However, the “vmstat” command displays only on output(average since reboot) if no delay value is given.
How to use a count value with delay in the vmstat command?
To stop the report generation after a certain number of reports, mention the count value after the delay value, as displayed below:
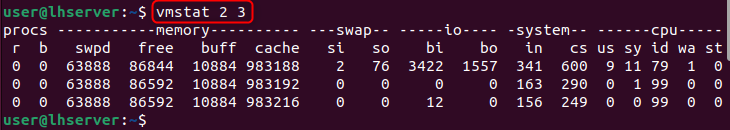
The output is displayed only 3 times as mentioned.
How to change units of the output in the vmstat command?
The default units displayed in the output are in KBs. We can change it as well by further mentioning the units followed by the “-S” option.
To mention the units, follow the terms:
k: 1000 bytes(decimal bytes)
K: 1024 bytes(hexadecimal bytes)
m: 1000 KBs(decimal bytes)
M: 1024 KBs(hexadecimal bytes)
To display output in megabytes, execute the command:
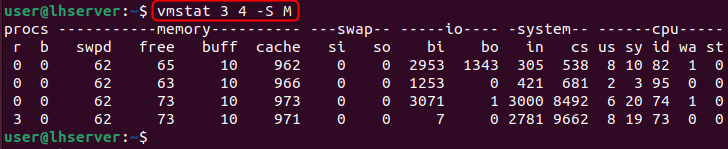
The output is displayed 4 times with a delay of 3 seconds in megabytes.
This is all from the vmstat command and its option. This article has given a detailed overview of the vmstat command in Linux.
Conclusion
The vmstat command is used to provide real-time insights into various system parameters making it a vital resource for system troubleshooting and optimization. Users can use vmstat’s functionalities to ensure maximum efficiency in the Linux environment by understanding the syntax, basic operations, and practical applications.