
Contents
Prerequisites:
To perform the steps that are demonstrated in this guide, you need the following components:
Virtual Memory in Linux
The physical memory, also referred to as RAM, is finite in amount. The kernel is responsible for distributing this space to all the running programs. All the running programs (including the OS) reside in RAM.
However, if the demand for memory is higher than its available memory, it simply crashes the system (or the program will ask for more memory space). In most situations, that’s an unwanted outcome. This is where virtual memory comes in.
Virtual memory refers to a dedicated disk space on your HDD/SSD that can act as additional memory in dire situations. Because it’s acting as RAM space (but not really), it’s considered as “virtual”. In UNIX/Linux systems, these spaces are referred to as swap spaces.
The Linux kernel moves the blocks of memory into swap space and retrieves them back to RAM as necessary.
The performance of the virtual memory is most definitely slower than the physical memory and is directly proportional to the performance of the storage device. However, in specific hardware configurations (using NVMe SSD, for example), the performance may be equivalent to RAM.
The Vmstat Command
The “vmstat” command is a monitoring tool that reports various info about the virtual memory. It’s available on all Linux systems as a part of the “sysstat” package.
The command structure of “vmstat” is as follows:
$ vmstat <options> <delay> <count>
Basic Usage
If it is run without any parameter, “vmstat” prints the system info since the last boot:
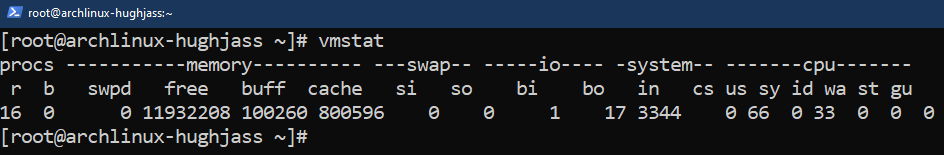
The output is arranged in six segments:
- procs: Statistics of processes that are currently running
- r: Number of active processes
- b: Number of sleeping processes
- memory: Statistics on memory usage
- swpd: Total amount of virtual memory (swap space)
- free: Available swap space
- buff: The amount of swap space being used as a temporary buffer memory
- cache: Total cache memory
- swap: Statistics about the swap space
- si: Rate of swapping in
- so: Rate of swapping out
- io: I/O statistics
- bi: Number of blocks received from the block device(s)
- bo: Number of blocks sent to block device(s)
- system: Statistics on scheduling
- in: System interrupts count
- cs: Rate of context switches
- cpu: Various CPU statistics
- us: CPU spending time on non-kernel processes
- sy: CPU spending time on kernel processes
- id: CPU spending time idling
- wa: CPU spending time waiting for I/O operations to complete
- st: CPU time used by a virtual machine
Changing the Display Unit
By default, “vmstat” reports the memory values in kilobytes. To change the unit, use the “-S” flag:
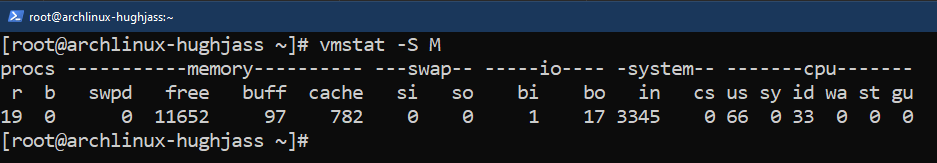
Here, “vmstat” prints the values in megabytes.
There are several memory units available:
- M: 1048576 bytes (2^20 byte)
- m: 1000000 bytes (1000 kilobyte)
- K: 1024 bytes (1 megabyte)
- k: 1000 bytes (1 kilobyte)
Continuous Statistics Update
By default, “vmstat” prints the report once. However, we can instruct “vmstat” to provide continuous reports at a specified time interval (in seconds).
The command structure is as follows:
For example, to get the updated stats every 2 seconds, the command is as follows:
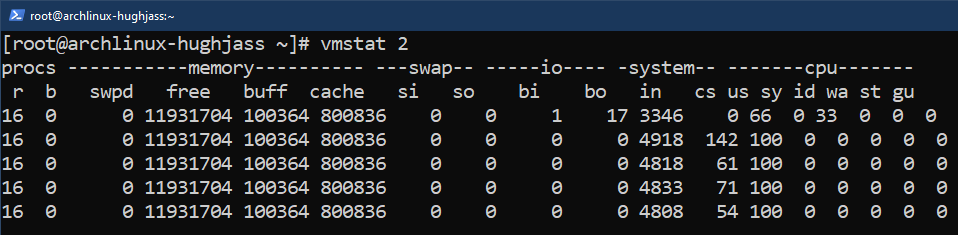
The output won’t stop unless it is manually terminated using “Ctrl + C”.
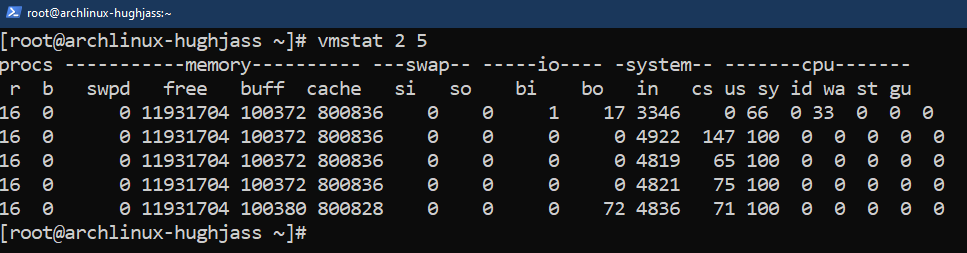
Alternatively, we can specify “vmstat” to provide the stats for a specific number of times:
For example, to get the updated stats every 2 seconds for 5 times, the command looks like this:
Active and Inactive Memory
Active memory refers to the memory space that’s currently being used by a process. On the other hand, inactive memory refers to the memory space that was assigned to a process that’s no longer running.
Using “vmstat”, we can check the amount of active and inactive memories being used:
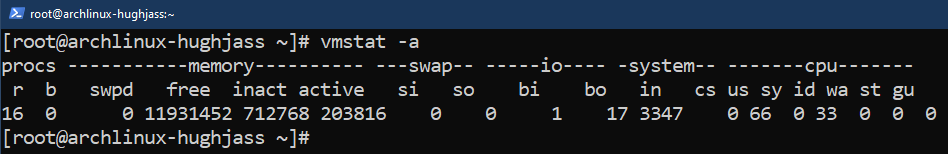
Here, the “buff” and “cache” columns are replaced by “inact” and “active” columns, respectively.
Memory and Scheduling
To get a more detailed report on memory and scheduling, use the following command:
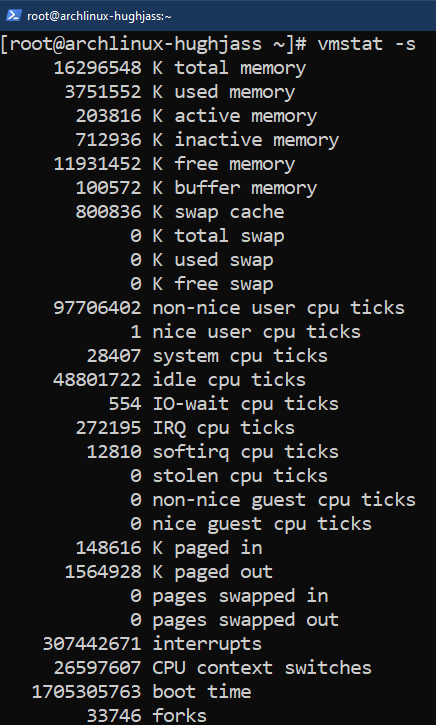
Here:
- Section 1: This section deals with the basic system info like total physical memory, active/inactive memory, free/buffer/cache memory, etc.
- Section 2: Various CPU statistics
- Non-nice CPU ticks: How many times the high priority processes used the CPU.
- Nice CPU ticks: The number of times the lower priority processes used the CPU.
- System CPU ticks: The number of times the kernel processes used the CPU.
- Idle CPU ticks: The number of times the CPU stood idle.
- IO-wait CPU ticks: The number of times the CPU waits for I/O management.
- IRQ: The number of times CPU received the interrupt requests.
- softirq: The number of times the CPU received the software interrupt requests.
- stolen CPU ticks: The number of times VMs stole the CPU time.
- Section 3: Memory paging stats
- Section 4: Event counters
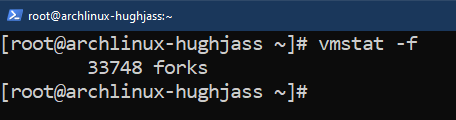
Forks since Boot
Forks refer to processes that were spawned by existing processes. To get the statistics on fork counts, run the following command:
Disk and Partition Statistics
The “vmstat” command can also provide an info about disk activity. To get a quick summary of disk activity, run the following command:
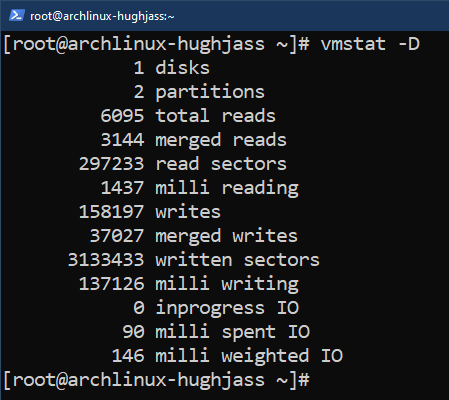
To get a more detailed disk activity report (including read/write stats), use the following command instead:
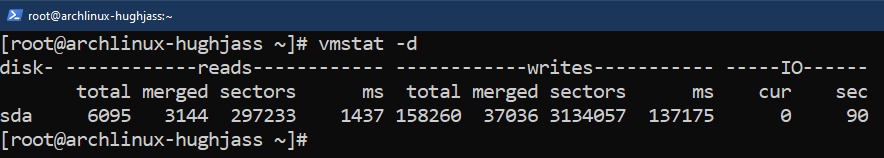
Here:
- Reads
- total: Total disk read count
- merged: Total group reads count
- sectors: Total number of sectors read
- ms: Total amount of time to read the data from the disk (in milliseconds)
- Writes
- total: Total disk write count
- merged: Total group writes count
- sectors: Total number of sectors written
- ms: Total amount of time to write to the disk (in milliseconds)
- IO
- cur: Total current disk reads/writes
- sec: Amount of time spent in ongoing reads/writes operation (in seconds)
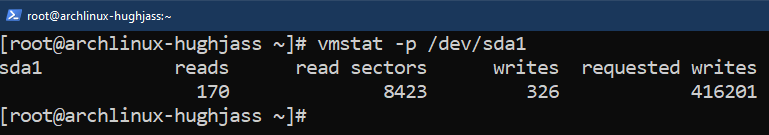
The “vmstat” command can also generate reports for a specific disk partition. To get the partition report, use the following command structure:
$ vmstat -p <partition_identifier>
Slab Statistics
Slab allocation is designed to be an efficient mechanism for the objects’ memory allocation. Compared to previous mechanisms, slab allocation offers a reduction of memory fragmentation (caused by memory allocation and deallocation).
To check the slab statistics of the system, use the following “vmstat” command:
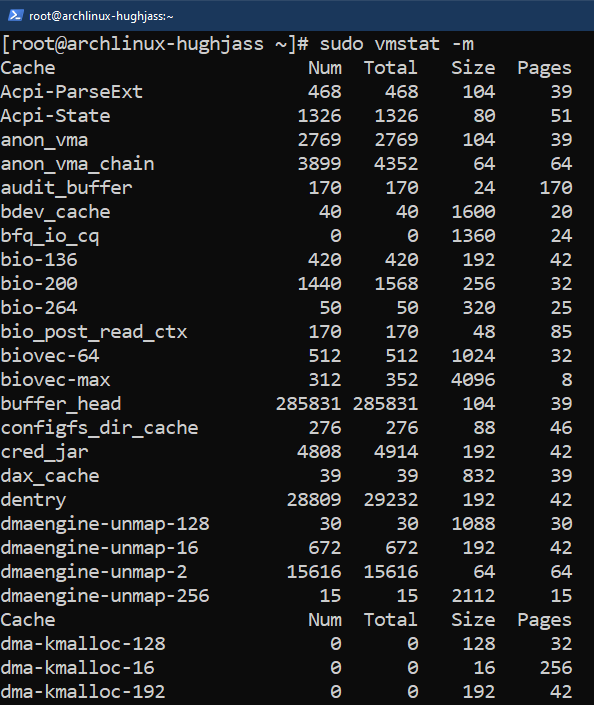
Note that it requires a root permission to view the stats.
Here:
- Cache: Name of the cached data
- Num: Number of objects that are active in the Num cache
- Total: Total count of objects in a particular cache
- Size: Size of the cached objects
- Pages: Count of memory pages that contain the cached objects
Conclusion
In this guide, we showcased the various ways of using the “vmstat” command. Besides virtual memory, “vmstat” can also report on disk statistics, forks, slabs, and more.
Interested in learning about other system monitoring tools? Learn more about htop, kill, ps, etc.
Happy computing!